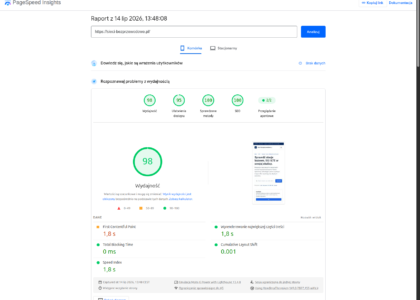
On WordPress, the work order for Core Web Vitals that makes sense is simple: first measurement and a backup, then a diagnosis of the report, and only at the end plugins and code changes. Skipping it ends the way many performance projects do: another cache plugin, clicked-through presets and changes rolled back after two days because the cart or the menu fell apart. Without a recorded starting point, nobody can say what helped and what hurt.
Table of contents
Measure first, only then any plugin at all
Before you touch the configuration, make a copy of the child theme and the database. Some fixes will have to be undone, and without a reference point undoing turns into guesswork. A few minutes of work that later saves an entire week.
Mobile and desktop measurements sit in separate cache entries. A plain request to the address warms up only the desktop variant, so a mobile test hits a cold cache and shows an understated result. The first run after a full purge always comes out worse, because the combined CSS and JavaScript files are only just being generated.
The same configuration gives different numbers between runs, which is why I look at the median of several measurements, not at a single reading. For iteration a local tool is more convenient: it works fast and does not limit requests. The verdict is issued by Google’s tool, while the indicator in the hosting panel alone says nothing about what actually needs fixing.
How to read the report so you hit the bottleneck instead of guessing
We always open the report in the same order, because only that order adds up to a diagnosis:
- the raw metrics, before you look at the list of suggestions
- the LCP node and what it actually is
- the network request timeline
- the breakdown of main thread work
- the causes of layout shifts
The sum of server response time, the delay in discovering the image and the time to download it immediately shows whether the culprit is the hosting, the template or the graphics. If it is server response time dragging the score down, no plugin will make up for it and the conversation moves to fast hosting for company websites. Three separate conversations and three separate cost estimates.
When the main thread is busy mostly with styles and layout recalculation rather than executing scripts, cutting JavaScript will do nothing. Look then at stylesheet size and the number of elements in the tree. A long task entry pointing at the document itself means inline scripts and handlers pasted into the template, not a library file. And the most common mistake: work starts with whatever is easiest to click, instead of with the biggest cost in the report.
LCP: the culprit is usually element visibility, not image weight
The single most expensive problem is an LCP element hidden until JavaScript initializes. A carousel, a slider or a section built by a script waits for the whole dependency chain. Compressing the file rescues nothing then, since the browser learns about the image only after the code has run.
A preload hint works only when it sits at the very top of the head section, ahead of structured data and analytics scripts. Lower down it loses its point, because the parser reaches it too late. Also check whether the banner on a phone is not being served at full desktop size instead of the variant generated by WordPress. In premium templates this is an almost serial mistake.
Background images painted by a script in bulk, together with the ones below the fold, compete for bandwidth with the LCP image and can eat up the entire gain from optimizing the graphics. With carousels one more trap is waiting: revealing the first slide without hiding the rest fixes LCP but generates layout shifts. One metric grows at the expense of another.
CLS and fonts: a trade-off that no single CSS rule settles
Rules that protect the layout, written into the theme stylesheet, will not work if that stylesheet loads asynchronously. They have to go inline into the head section and be excluded from optimization, otherwise they arrive after the first paint.
The same mechanism applies to typefaces. Font declarations in a combined, asynchronous stylesheet arrive too late, so swapping the typeface shifts the headings. Injecting the declarations inline removes the ordering problem, but it holds back text display and worsens FCP. Preloading weights improves stability, only those dozen or so kilobytes travel at high priority next to the LCP image and spoil the score on the other side. Take your pick.
Without a fallback with matched metrics you are choosing between FCP and CLS, and the variant with font-display: optional is a decision for the brand owner, not a technical one. Remember too that automatically generated critical CSS does not include styles added by JavaScript, so height reservations for sliders are written out by hand.
TBT rises after a good change and that is not a regression
The work JavaScript does is essentially constant. As long as the page loaded slowly, it ran outside the measurement window. After the speedup it moves inside and starts being counted. A TBT jump right after shortening FCP is a sign that the change worked, not a reason to revert it.
Delaying scripts until the first interaction can be tempting. But applied to jQuery, the menu and the slider it ends with navigation that does not work. It is a workaround, not a diagnosis, and it has to be named as such to the client. Combining and delaying are coupled as well: a file excluded from only one list will still land in the shared, delayed bundle.
Exclude specific files instead of whole directories. Excluding a directory also drags onto the critical path the heavy libraries that were meant to stay quietly where they were. While you are at it, check whether the pattern matches the actual filename, given that the minified variant of a library is named differently from the source one.
Maintenance: what breaks three months after the rollout
All changes go into the child theme, and file swaps are done with filters on handles. Otherwise the first template update erases the work without a trace. Replaced minified files and font subsets have to be regenerated after every update and versioned in the URL, because a long browser cache can hold an old file for months.
The queue for generating critical CSS is limited, and with multilingual sites it clogs up with translations and technical addresses. The result? Some subpages never get it. Purging the cache does not clear either the critical CSS or the mobile variant. These are separate mechanisms and they are checked separately.
After every change in the code we verify login, the sitemap, the RSS feed, the 404 error page and the language versions. A change log with a list of dead ends spares the next contractor from repeating tests that were already rolled back once. Without that discipline the Core Web Vitals WordPress score slides back on its own, after plugin updates and ordinary content edits.
A sensible order instead of a plugin list
Measure, read the report in the established order, fix LCP, then layout stability, and only at the end the load on the main thread. That is what page speed optimization looks like at our place in practice, and this sequence follows from the dependencies between the metrics, not from preference.
Separate what was measured from what was judged, and say plainly when a fix is a workaround. Mobile measurement results scatter quite a bit, so report a range from several runs instead of one impressive number. A client who understands that scatter does not call at seven in the morning asking about two points down.
If you need a performance audit, a modernization of an existing system, integrations, automation or an MVP rollout, get in touch. It is worth combining that with an SEO audit of your website, because speed and visibility in search pull each other along. We will gladly review your configuration and tell you what is genuinely worth improving.